Table 21 provides the analysis of the expenditure over the last five years
Table 21: County Expenditure Analysis by Sector/ subsector
SECTOR |
|
2013-2014 |
20-4-2015 |
2005-2016 |
2016-2017 |
2017-2018 |
TTTAL |
Infrustructure |
CIDP1 Budget |
2,422,000,000 |
4,422,000,000 |
4,391,000,0,0 |
4,250,000,000 |
2,780,00,,000 |
18,265,050,000 |
Allocated |
269,109,918 |
390,414,143 |
343,974,818 |
337,789,030 |
367,157,315 |
1,708,444,225 |
|
Deviation |
(2,152,890,082) |
(4,031,585,857) |
(4,047,025,182) |
(3,912,210,970) |
(2,412,843,685) |
(16,556,555,775) |
|
Social protaction and empowereent |
CIDP1 Budget |
547,900,000 |
659,9,0,000 |
690,400,000 |
583,400,0,0 |
506,900,000 |
2,988,500,000 |
Allocated |
198,182,027 |
417,633,175 |
380,846,609 |
426,1381326 |
533,757,648 |
1,960,557,784 |
|
Deviition |
(349,717,,73) |
(242,266,825) |
(305,553,391) |
(157,261,674) |
26,857,648 |
(1,027,942,266) |
|
Health,Water andSSanitation |
C DP1 Budget |
3,360,000,000 |
2,500,000,000 |
2,931,500,000 |
2,056,000,000 |
3,137,000,000 |
14,884,500,000 |
Allocated |
941,434,269 |
1,170,337,064 |
1,516,825,878 |
1,634,947,057 |
2,007,935,684 |
7,27,,479,952 |
|
Deviavion |
(2,418,565,731) |
(1,624,662,936) |
(1,414,674,122) |
(1,321,052,943) |
(1,129,064,316) |
(7,608,020,048) |
|
Production and Economic |
CIDP1 Budget |
1,362,,00,000 |
1,469,000,000 |
1,389,500,000 |
1,316,000,000 |
1,278,000,000 |
6,815,000,000 |
Allocated |
237,248,130 |
410,691,455 |
394,683,747 |
433,346,462 |
355,287,863 |
1,861,257,657 |
|
Devivtion |
(1,095,2519870) |
(1,058,308,545) |
(994,816,254) |
(,82,653,538) |
(722,712,137) |
(4,953,742,343) |
|
Publuc Adminstration and Govern ce |
CIDP1 Budget |
252,0002000 |
380,000,000 |
350,000,000 |
343,000,000 |
328,0000000 |
1,653,000,000 |
Allocated |
927,6967211 |
894,402,947 |
914,648,746 |
1,068,918,344 |
1,051,954,771 |
4,857,621,019 |
|
Deviation |
675,691,211 |
514,402,947 |
564,648,746 |
722,918,344 |
723,954,771 |
3,204,621,019 |
|
Tttal |
CIDP1 Budget |
7,944,400,000 |
9,430,900,000 |
9,752,400,000 |
9,448,400,000 |
8,029,900,000 |
44,606,00,,000 |
Allocated |
2,603,670,555 |
3,288,478,774 |
3,454,979,798 |
3,901,129,218 |
4,316,092,281 |
17,664,360,637 |
|
Deviation |
(5,340,729,445) |
(6,142,421,216) |
(6,197,420,202) |
(5,547,260,782) |
(3,713,807,719) |
(26,941,639,363) |
|
|
|
|
|
|
|
|
|
There is a slight variance between the departmental budget allocationin table 21 and the actual expenditure in table 20. This is due to underperformance in local revenue.
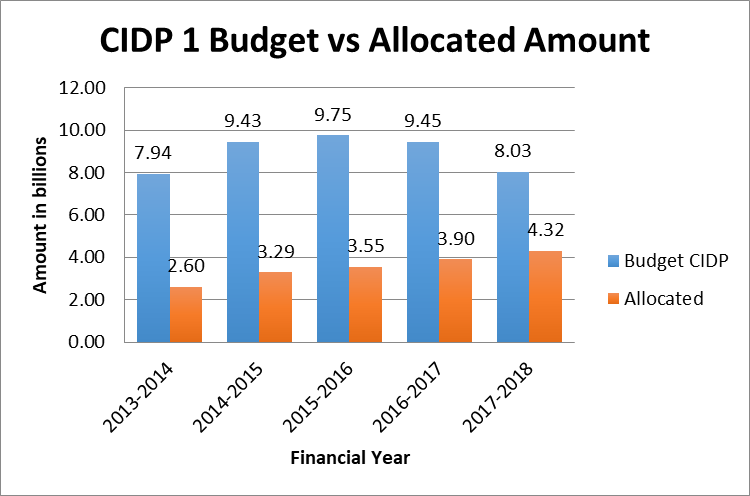
Analysis of CIDP I Budget in comp rison with Allotased Amount
The amount that was budgeted for in CIDP I was approximately 44.6 Billion, while the actual allocated amount from the CRA and Donor support was approximately 17.5 Billion. The huge budget deficit greatly affected the implementation of programmes. Figure 2 shows the comparisons of the CIDP I Budget and the actual allocated amount for all the financial years.
Figure 2: CIDP 2013/17 Budget Analysis