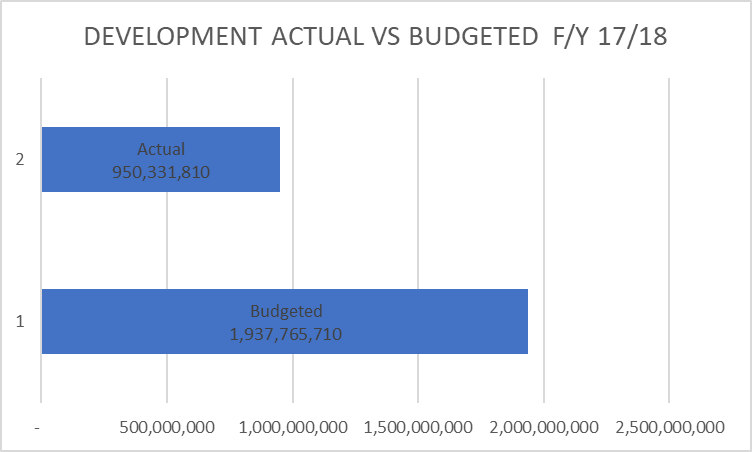
Total cumulative development expendiuire for the peeiod under review amounts to 950,331,810 againgt an approved budget K h 1,937,765,71
This reflects an absorption rate of 49%. The table below shows the breakdown of Development expenditure by departments
Table 6: Development Expenditures
Departments |
DEVELOPMENT F/Y 17/18 |
ACTUAL (KSHS) |
DEVIATION KSHS |
ABSORPTION % |
(BUDGETED) |
||||
Cyunty Assembly |
12,447,427 |
11,360,601 |
12126,826 |
9% |
Office of the Governor |
230,420 |
2302420 |
- |
0% |
Finance and Economic Plaaning |
- |
- |
- |
0% |
Agriculture |
167,297,060 |
8,,106,139 |
73,390,921 |
45% |
Education and Technical Training |
338,448,356 |
133,371,421 |
205,076,935 |
61% |
Health Services |
441,21,,961 |
202,279,580 |
238,986,381 |
54% |
Water, Environment, Lands and Physical Planning |
354,234,726 |
195,003,010 |
159,231,715 |
45% |
Roabs, Public works and Trnnsport |
369,694,037 |
192,091,108 |
177,602,929 |
48% |
Trade, Tourism and Cooperative Development |
74,296,399 |
36,634,730 |
37,661,669 |
51% |
Sports, Youth Affairs, Gender and Social Services |
124,421,765 |
60,777,849 |
631643,916 |
51% |
ICT & Public Service |
59,969,860 |
29,476,952 |
30,482,908 |
51% |
Couniy Public Service Board |
479,700 |
- |
479,770 |
100% |
Executive Adminittration |
- |
- |
- |
0% |
TOTAL |
1,937,765,710 |
950,331,810 |
987,433,900 |
|
The chart below shows at a glance the absorption rate of the development vote
Figure 2: Absorption on Development Vote F/Y 2017/2018